注重体验与质量的电子书资源下载网站
分类于: 设计 其它
简介

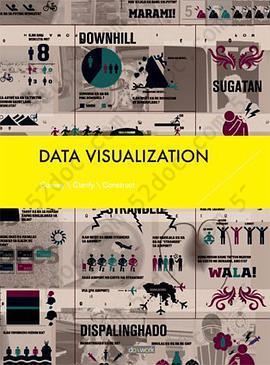
DATA VISUALIZATION: Convey \ Clarify \ Construct 豆 9.1分
资源最后更新于 2020-10-05 18:42:43
作者:dowork publishing
出版社:dowork
出版日期:2011-01
ISBN:9789881568212
文件格式: pdf
标签: Visualization 设计 信息设计 数据可视化 Data infographic design visualization
简介· · · · · ·
In prehistory, early humans created the first information graphics: cave paintings, later maps and now charts. In the age of internet, infographics seems to change the way people take in information.
Data Visualization presents a comprehensive selection of innovative designed diagrams, ranging from maps to text-based diagrams, to process-based flow, to three-dimensional diagram...
目录
I. Statistical Based Infographics
II. Text Based Infographics
III. TimeLine Based Infographics
IV. Process Based Infographics
V. Location or Geography Based Infographics
II. Text Based Infographics
III. TimeLine Based Infographics
IV. Process Based Infographics
V. Location or Geography Based Infographics


